
Executive Summary
Using the Case_Study_Test-Portfolio, this worked example demonstrates NovaPrimeAlpha's optimization workflow — the inputs accepted, the constraints applied, and the outputs produced — under a defined set of assumptions.
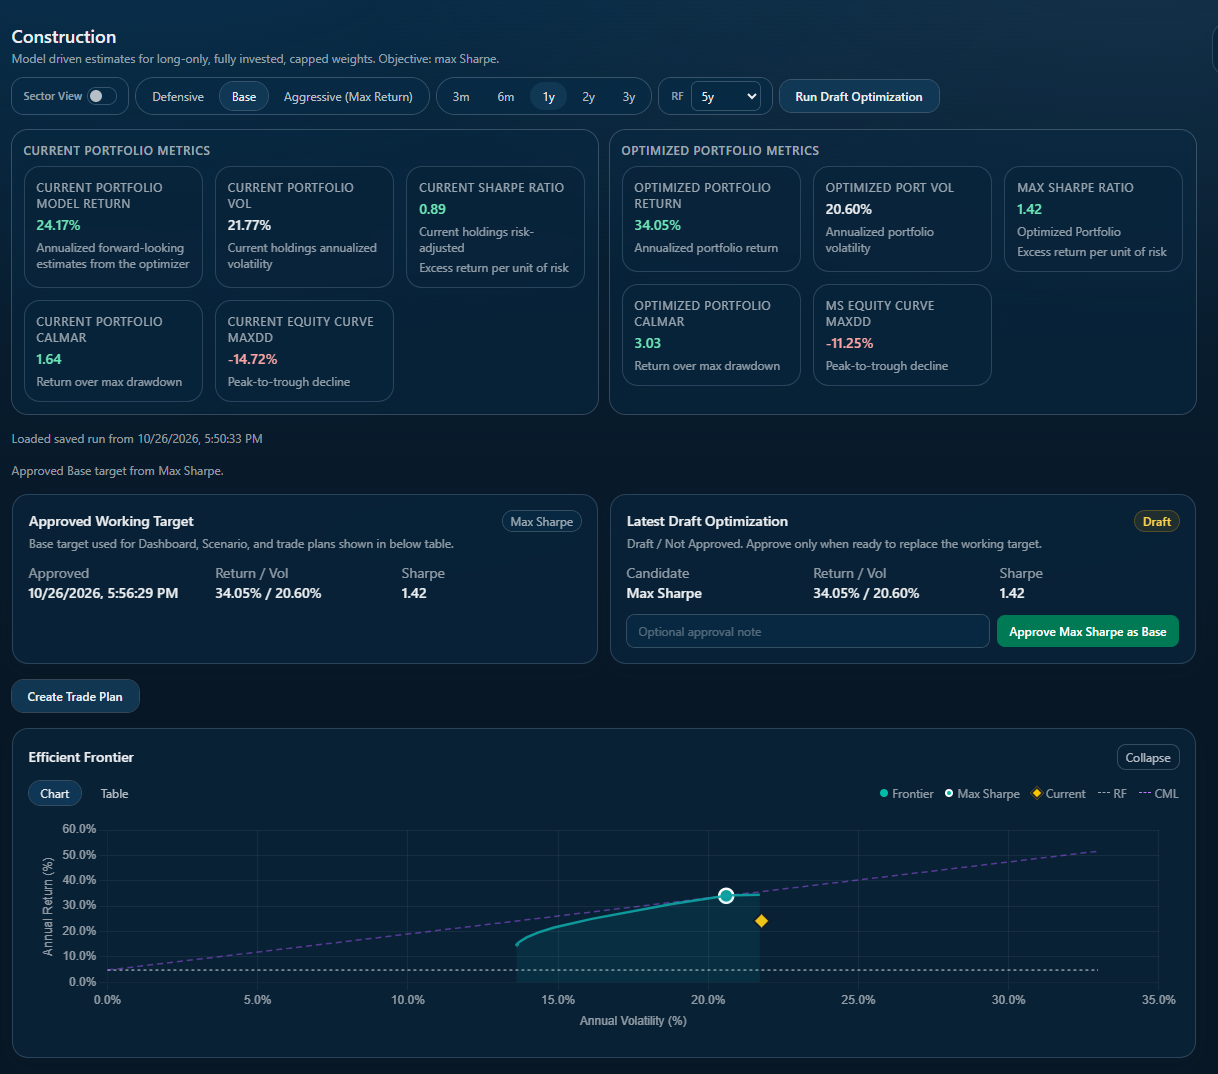
Under the stated estimation assumptions, the model-estimated Sharpe Ratio increased from 0.89 to 1.42, annualized return increased from 24.17% to 34.05%, volatility decreased from 21.77% to 20.60%, and maximum drawdown improved from –14.72% to –11.25% relative to the starting portfolio.
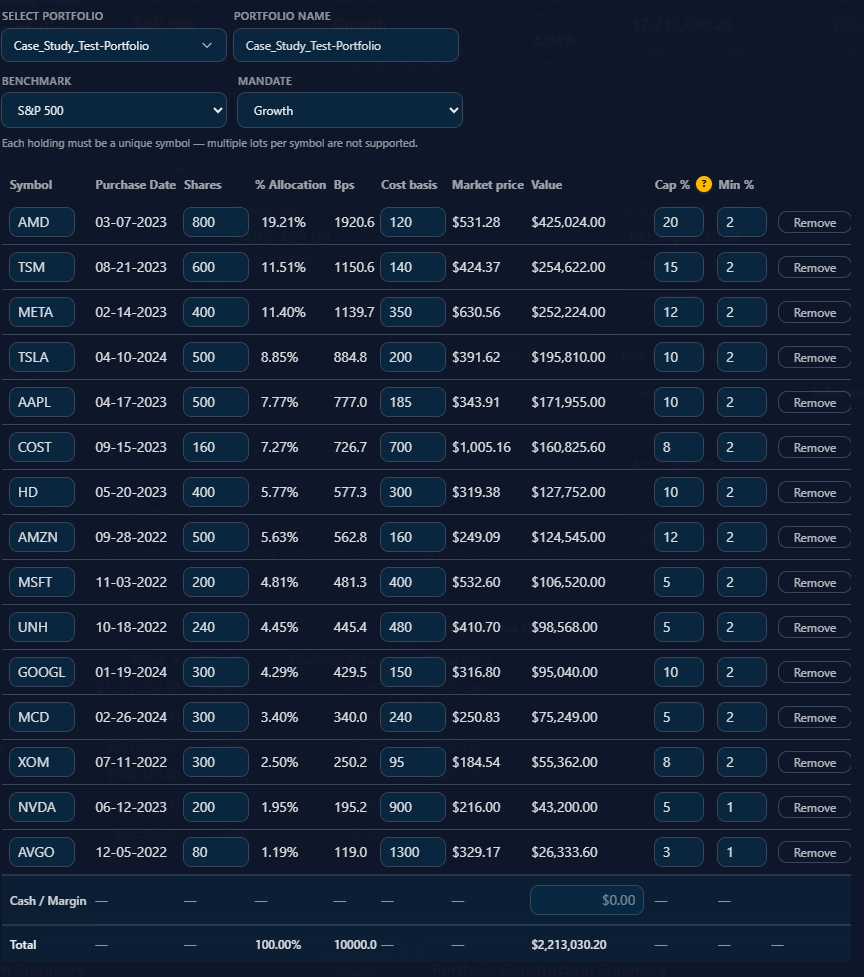
Step 1 — Portfolio Holdings Baseline
The illustrative portfolio consists of 15 U.S. equities across multiple sectors, each with defined position caps and minimums. These constraints are specified by the user and enforced by the optimizer throughout the workflow.
Total portfolio value: $2.21M. Top positions include AMD (19.21%), META (11.40%), TSM (11.15%), and TSLA (8.85%). All positions are subject to per-security cap and minimum constraints as entered.
Step 2 — Max Sharpe Weight Analysis
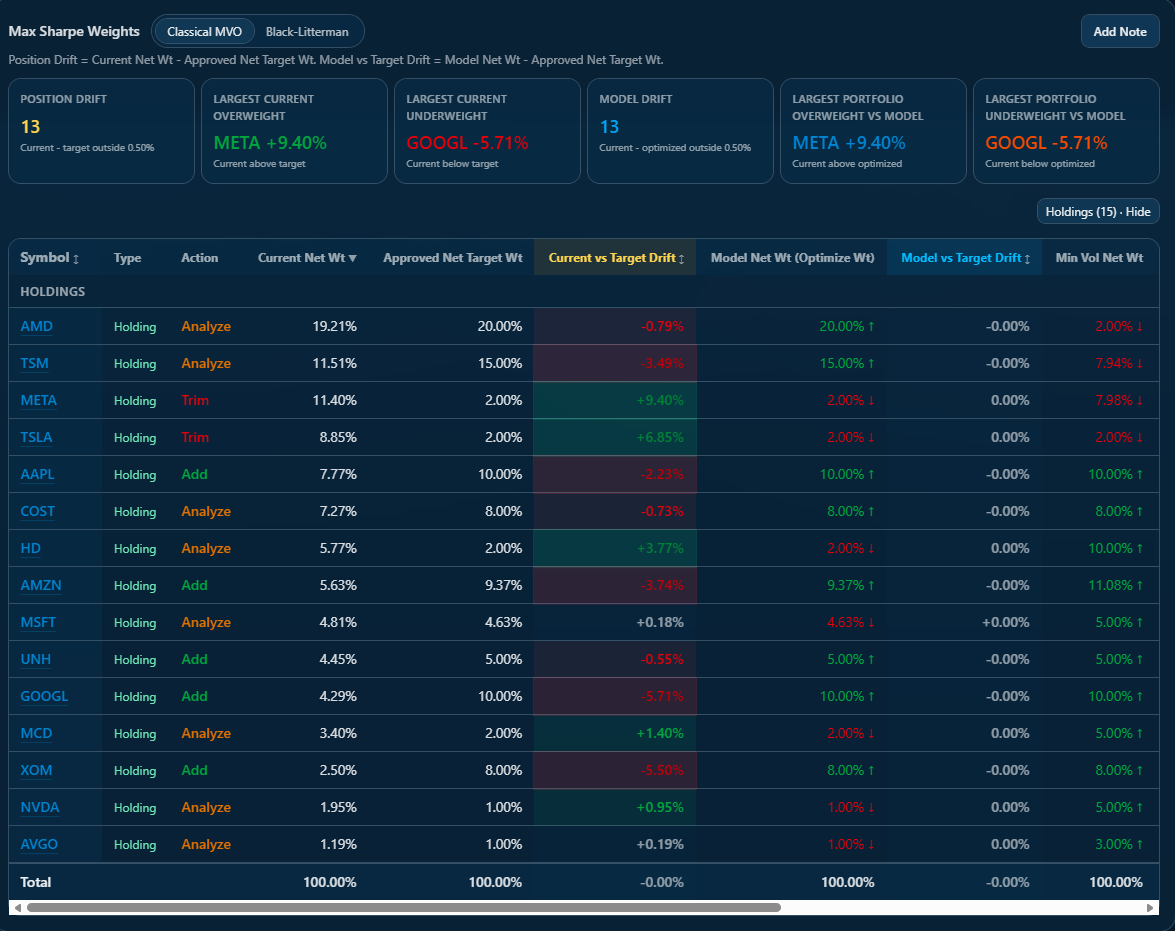
NovaPrimeAlpha applies Mean-Variance Optimization (MVO) under two models: Classical MVO and Black-Litterman. The optimizer identifies overweight and underweight positions relative to target and model weights, given the return and covariance estimates used as inputs.
Under the specified inputs, the optimizer reallocates toward positions with higher model-estimated risk-adjusted contribution — adding to AAPL, AMZN, GOOGL, and XOM — while reducing correlated exposures in META and TSLA. All user-defined position caps and minimums are respected throughout.
Step 3 — Efficient Frontier Visualization
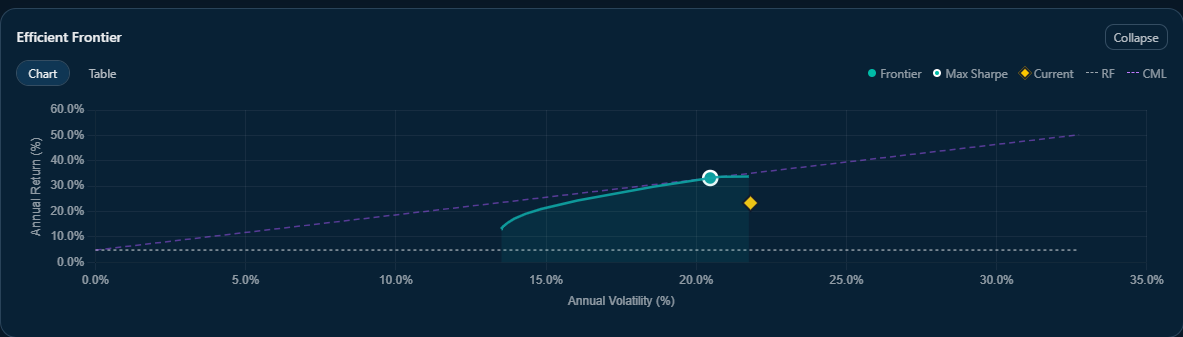
The efficient frontier chart shows the set of portfolios that maximize model-estimated return for a given level of model-estimated volatility, given the inputs provided. The starting portfolio plots below the frontier; the Max Sharpe solution plots on it.
The gap between the starting portfolio and the Max Sharpe point on the frontier represents the difference in model-estimated risk-adjusted return between the two constructions, under the same estimation assumptions.
Step 4 — Construction Dashboard: Before and After
The Construction Dashboard summarizes the difference between the starting and optimized portfolios across key model-estimated metrics. Under the specified inputs, the optimized portfolio has a higher model-estimated return and lower model-estimated volatility than the starting construction.
The model-estimated Calmar Ratio increases from 1.64 to 3.03 (+85% relative to the starting portfolio). The Calmar Ratio measures model-estimated return per unit of maximum drawdown; the increase reflects a higher model-estimated return with a shallower estimated drawdown under the same input assumptions.
Step 5 — Scenario Lab: Stress-Testing the Optimized Portfolio
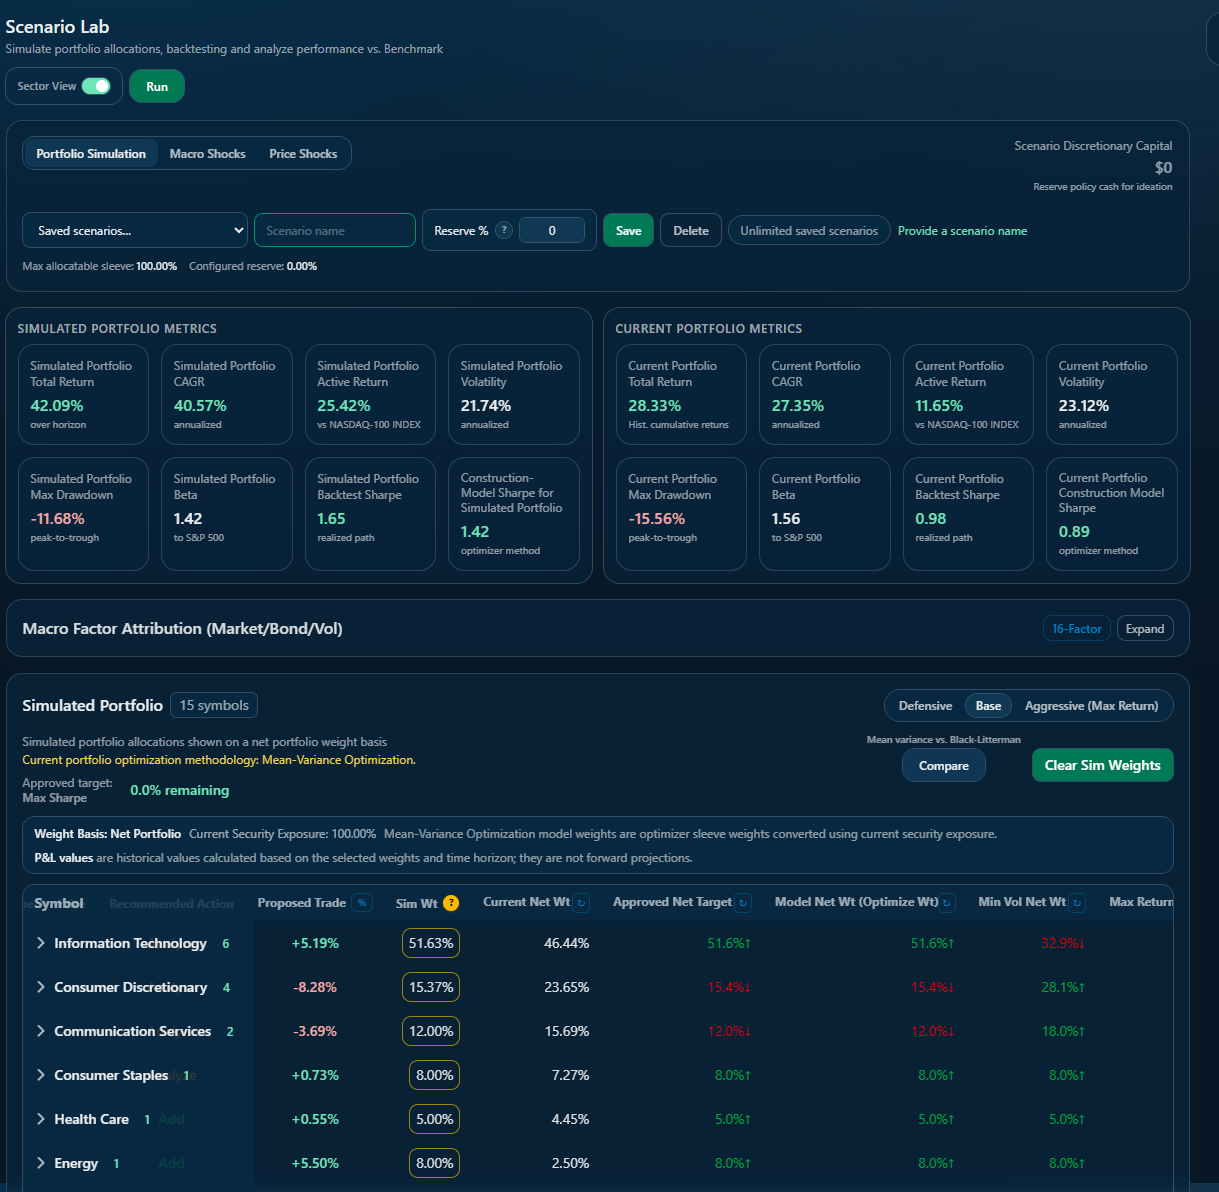
NovaPrimeAlpha's Scenario Lab supports stress-testing and hypothetical rebalances. Users can specify macro shocks, price shocks, and allocation changes and observe the model-estimated impact on portfolio metrics before any capital is committed.
In this illustrative scenario, the simulated portfolio produces a model-estimated 42.09% total return vs. 28.33% for the starting portfolio, with a model-estimated Sharpe Ratio of 1.65 vs. 0.98 and a shallower estimated max drawdown of –11.68% vs. –15.56%. These are scenario outputs under the specified shock assumptions, not return forecasts.
Step 6 — Performance Attribution: Reviewing the Calculation Output
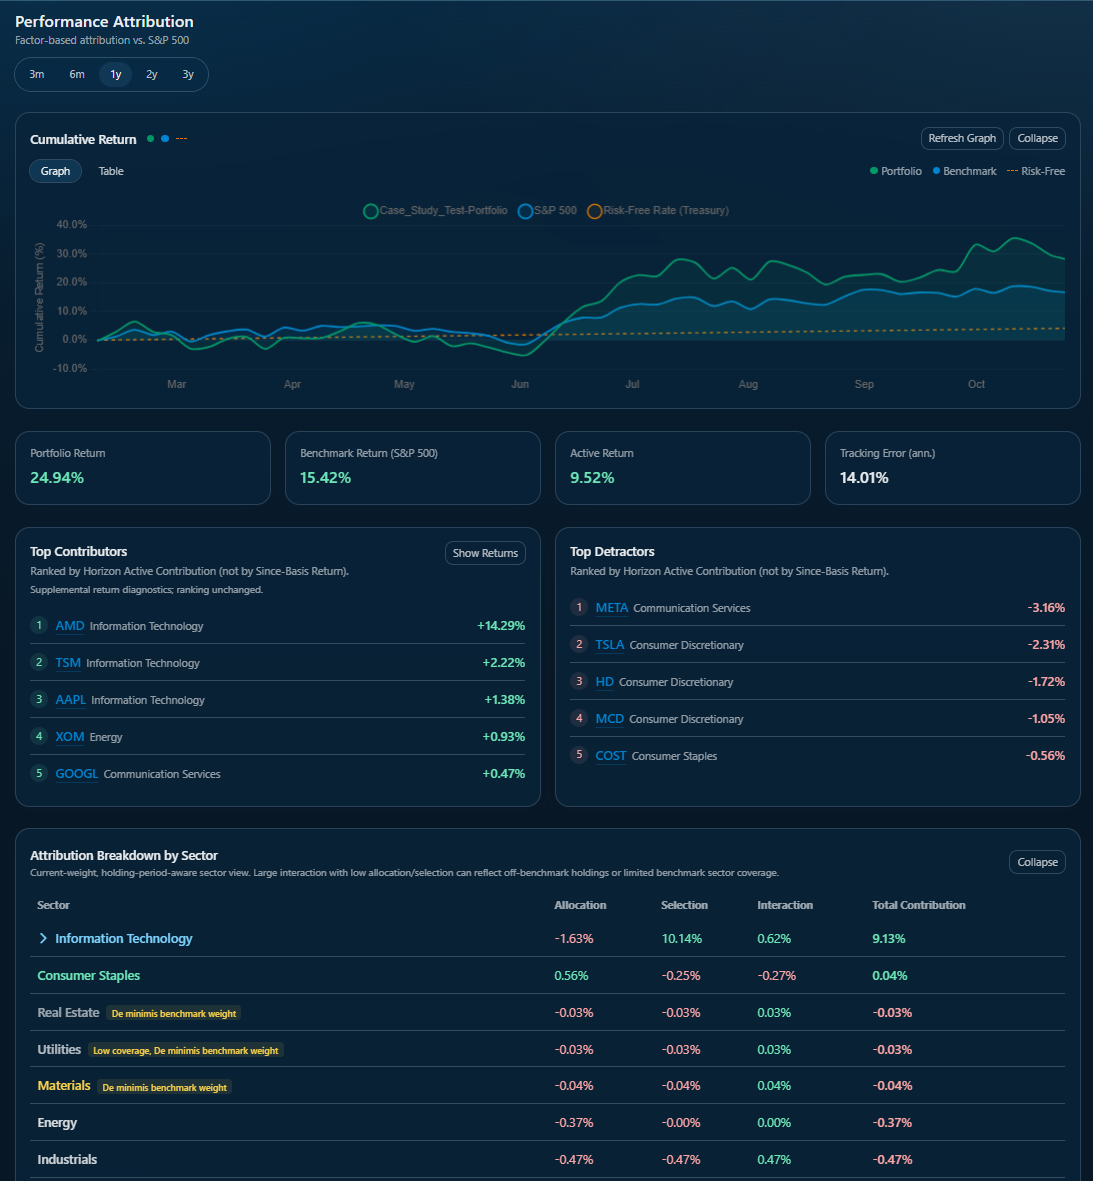
NovaPrimeAlpha's Attribution Lab decomposes portfolio return into factor and sector contributions using standard Brinson-Hood-Beebower attribution methodology. In this example, the portfolio generated 24.94% return vs. the S&P 500's 15.42%, producing +9.52% active return with a 14.01% annualized tracking error.
Top contributors in this example: AMD (+14.29%), TSM (+2.22%), AAPL (+1.38%), XOM (+0.93%), GOOGL (+0.47%). Top detractors: META (–3.16%), TSLA (–2.31%), HD (–1.72%). Information Technology drove the largest sector contribution at +9.13%, primarily through selection effects (+10.14%). These figures reflect the specific holdings and period used in this illustration.
| Metric | Starting Portfolio | Optimized (Max Sharpe) | Change |
|---|---|---|---|
| Model-Estimated Annualized Return | 24.17% | 34.05% | +9.88 pp |
| Model-Estimated Annualized Volatility | 21.77% | 20.60% | –1.17 pp |
| Model-Estimated Sharpe Ratio | 0.89 | 1.42 | +59% |
| Model-Estimated Calmar Ratio | 1.64 | 3.03 | +85% |
| Max Drawdown | –14.72% | –11.25% | Shallower |
Conclusion
This worked example illustrates how NovaPrimeAlpha processes a real portfolio through its optimization workflow: accepting user-defined constraints, applying constraint-aware MVO and Black-Litterman optimization, and producing auditable, step-by-step output at each stage.
Under the stated estimation assumptions, the model-estimated Sharpe Ratio increased by 59%, annualized return increased by 9.88 percentage points, volatility decreased, and maximum drawdown improved relative to the starting portfolio. These outputs reflect the model's calculations given the inputs provided — they are not return guarantees or predictions of future performance.
NovaPrimeAlpha supports constraint-aware MVO, Black-Litterman optimization, efficient frontier visualization, scenario stress-testing, and Brinson-Hood-Beebower performance attribution. These methods are available to portfolio managers, RIAs, institutional investment teams, and sophisticated individual investors at advisor-friendly pricing.
The question this example addresses is not whether optimization adds value in general — it is whether your current portfolio construction process is capturing the risk-adjusted return available under your own constraints and return assumptions. NovaPrimeAlpha provides the workflow to find out.
Ready to run the workflow on your portfolio?
See how NovaPrimeAlpha handles your own holdings, constraints, and return assumptions. Request a demo or launch the app directly.